
Live Charts or Pasted Images, and What Breaks
Every deck that gets reused past its first presentation runs into the same fork: link the chart to the spreadsheet so the numbers stay current, or paste it as an image so the layout stays put. Pick one and you inherit its failure mode. There is no version of this where both problems go away, only a version where you pick which one you would rather deal with.
The linked chart, and how it behaves
PowerPoint’s “Use Destination Theme & Link Data” paste option links an Excel chart into a slide instead of embedding a static copy. Microsoft’s support pages say you refresh linked data by right-clicking it and choosing Update Link. So the chart is current only when somebody runs that step.
The link can also break. Microsoft says that if the linked file is moved or deleted, you get an error when you try to edit the data. The fix is Change Source under File, Info, Edit Links to Files. Pick Break Link instead and the chart data becomes static.
Here is my opinion on the danger. A linked chart that nobody refreshed does not look stale. It looks like today’s number, with the same authority it had on day one.
The pasted image, and its opposite failure
Paste the chart as a picture and none of that happens. The image never breaks and never asks for a refresh. It also never updates, so the deck says whatever the spreadsheet said on the day you pasted it, until somebody makes a new picture and swaps it in. This is the failure people expect and manage: re-export the chart before every meeting and hope nobody presents last quarter’s deck by accident.
The third option
The third option is to generate the chart from the data when you render the deck. Nothing links. Nothing is a frozen picture. The chart is exactly as current as the data at the last render.
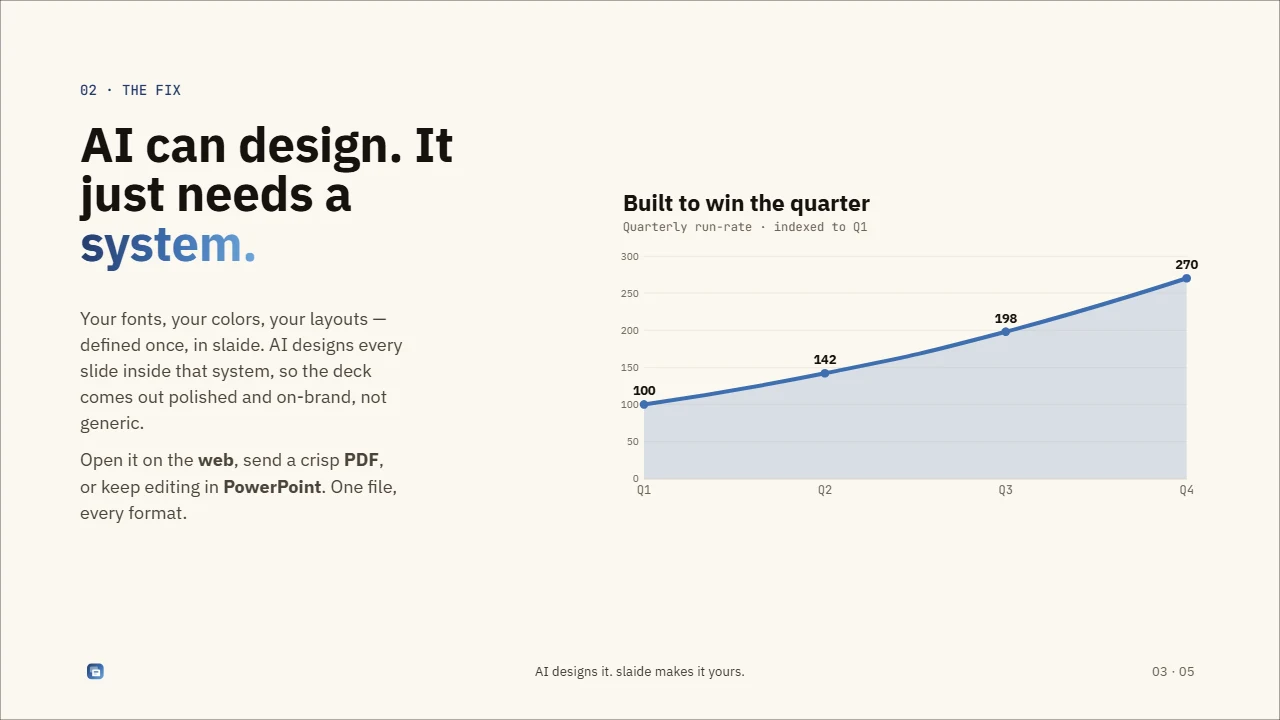
In Slaide, a chart is a fenced echart block in the deck file. You write an ECharts option as JSON or YAML, and the language docs say slaide build bakes it to a static SVG. Series colors come from the theme. The deck author edits the numbers in text and re-renders, the same motion as fixing a typo.
Here is the limit, and it is bigger than it sounds. The numbers sit inside the deck file. Slaide does not pull them from a spreadsheet for you. If the real numbers live in another system, someone has to copy them in, or you write a script that fills the block before the build. That script is your own work, not a Slaide feature.
Which failure you would rather have
A linked chart can fail silently and look current when it is not. A pasted image fails openly, because everyone already knows to ask whether it is the latest version. A chart in the deck file fails when nobody updates the numbers or runs the build again. That failure is at least one you can schedule around.
None of the three removes the real job, which is somebody deciding the data is worth trusting before it goes in front of a room. What changes is where that job sits. With a linked chart it sits with whoever last refreshed the link. With a pasted image it sits with whoever re-exported before the meeting. With a chart in the deck file it sits with whoever owns the numbers in that file, which is at least one named person.